


Supervisors
Healthy Buildings Dashboard
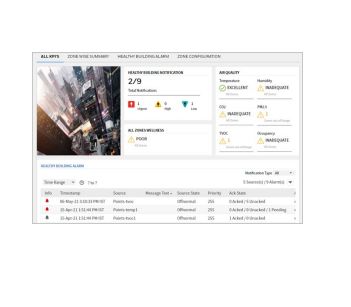
The Healthy Buildings Dashboard provides a score (Healthy Building Score) that enables the person responsible for a building to understand their building’s Key Performance Indicators (KPIs).
The Healthy Buildings Dashboard provides a score (Healthy Building Score) that enables the person responsible for a building to understand their building’s Key Performance Indicators (KPIs).
The following KPIs are used by Healthy Building Dashboard Temperature, CO2, Humidity, PM2.5, TVOC, and Occupancy in conjunction with sensor feedback values to calculate the Healthy Building Score. The Healthy Building Score provides an indication of comfort level and environment safety of the building. Honeywell intelligent sensors, combined with powerful computing, evaluate live sensor output and historical data to provide realtime insights into the health of the building. The Healthy Building Dashboard provides visibility of this information in a user friendly way. It provides visibility of the health of a portfolio/Region/Building and its underlying zones. This helps to the building manager understand issues in the building and prioritise corrective actions
Features & Benefits:- Visibility of healthy building score information in a user friendly way.
- Calculation of Healthy Building Score for multiple KPI across multiple zones